

Time Series of Post-1950 First Arrival Dates for Individual Species in SMAD
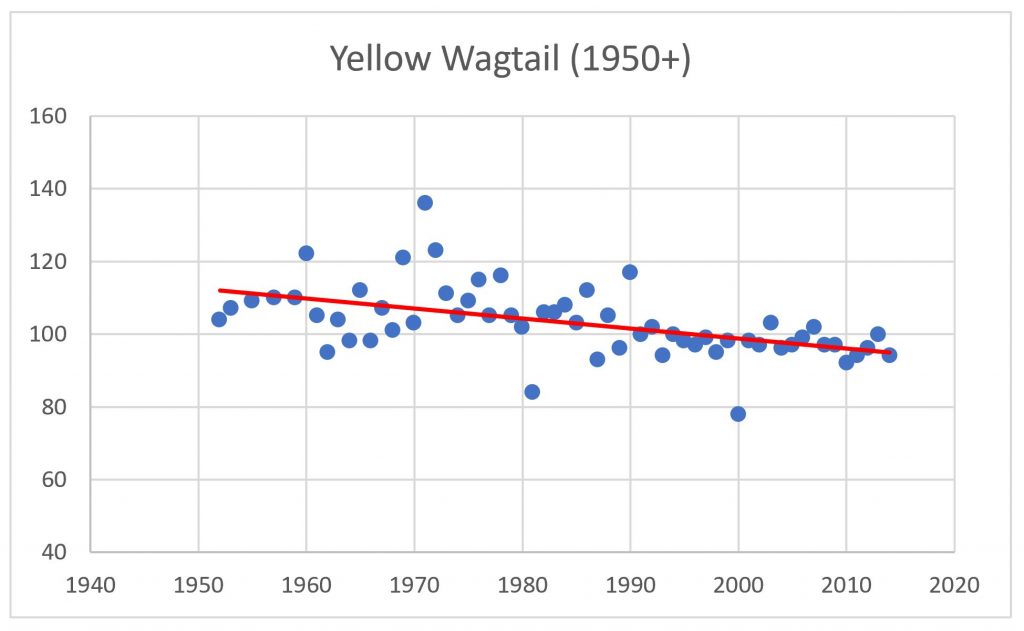
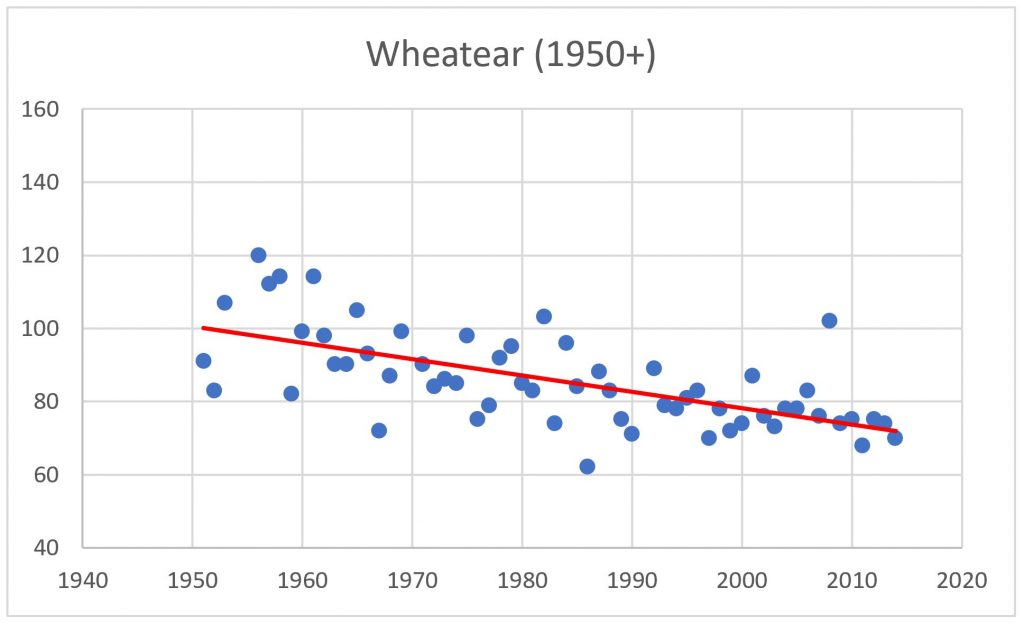
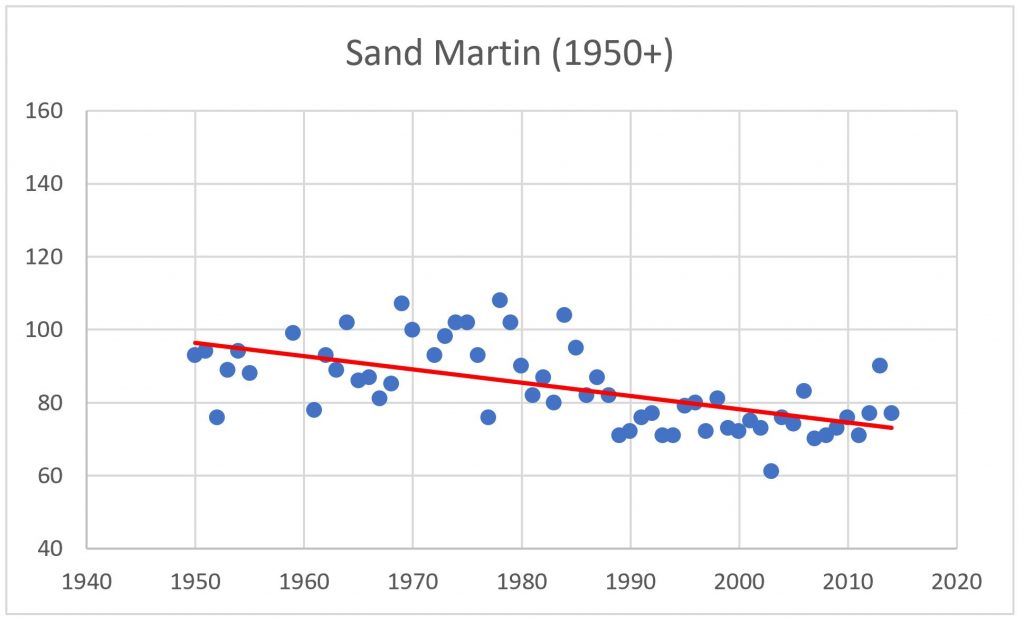
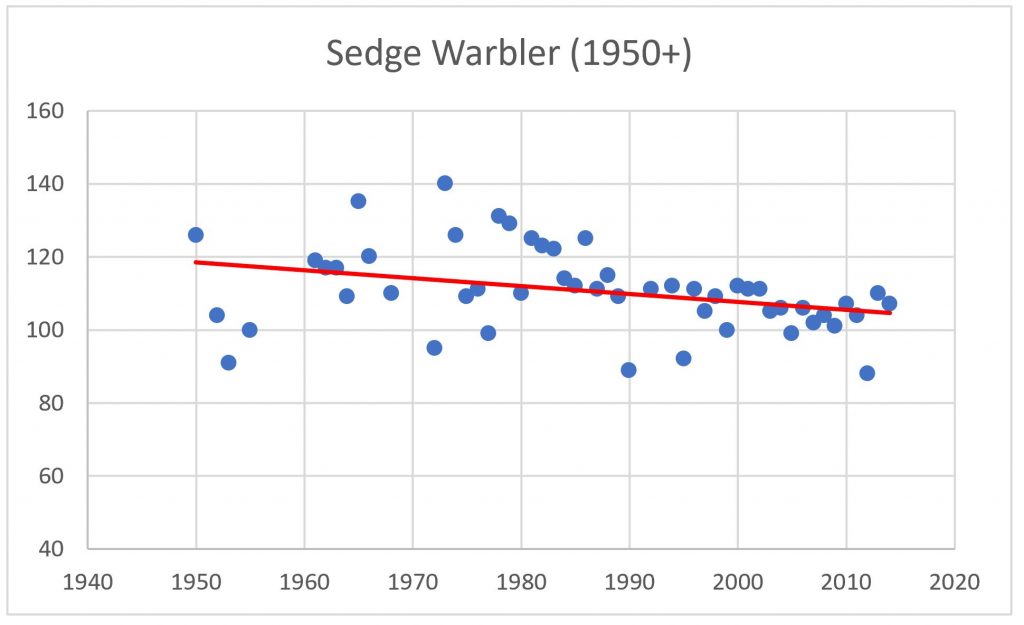
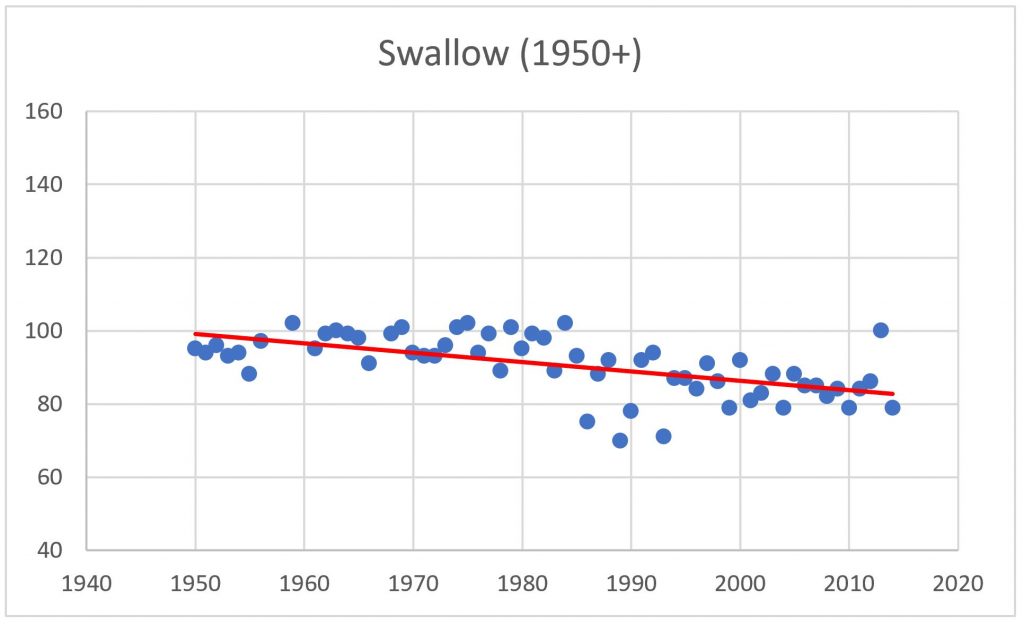
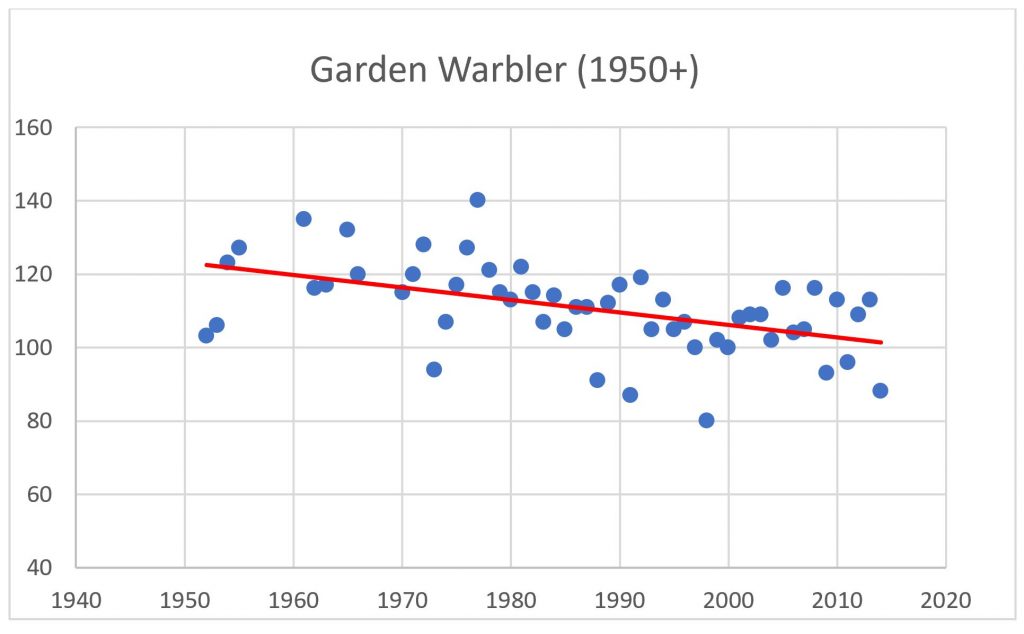
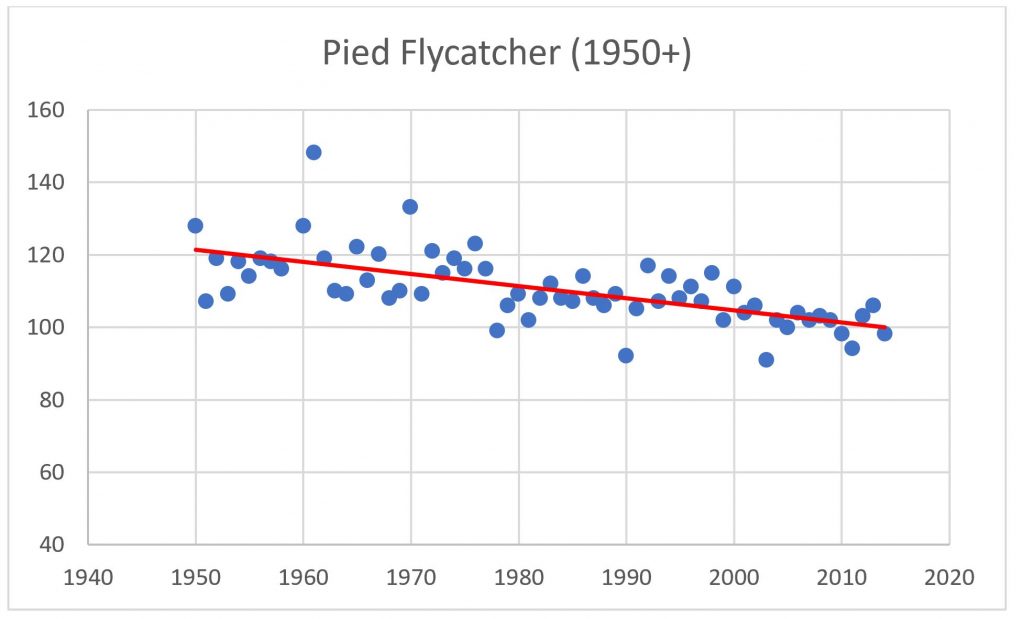
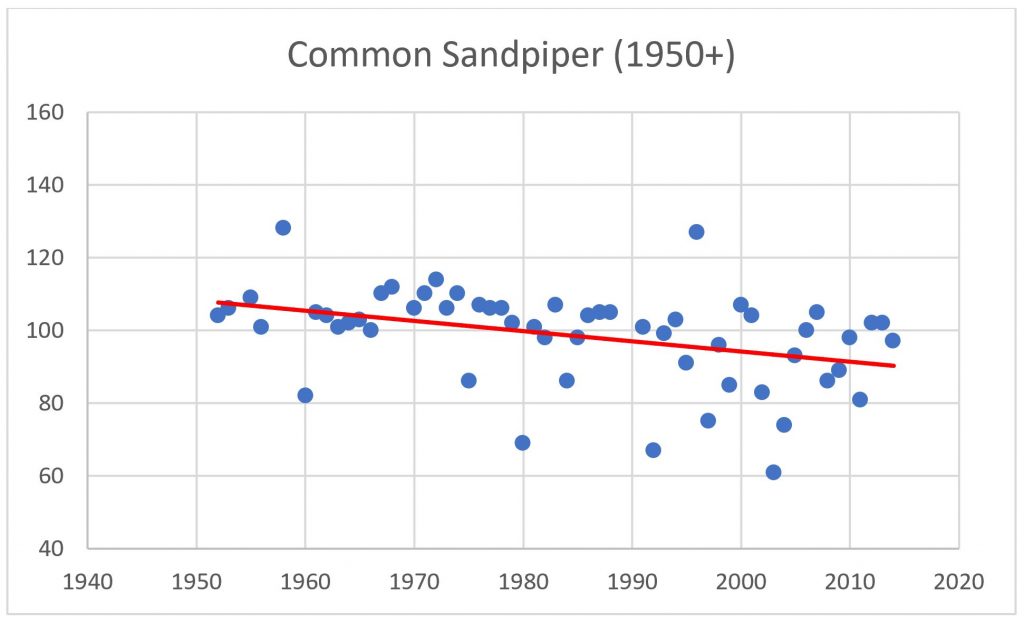
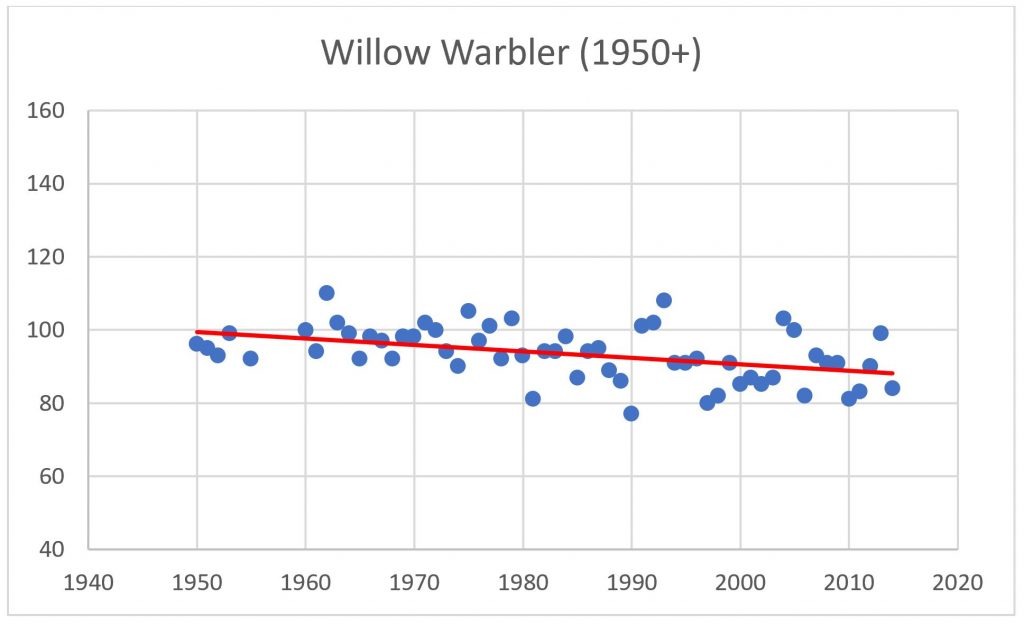
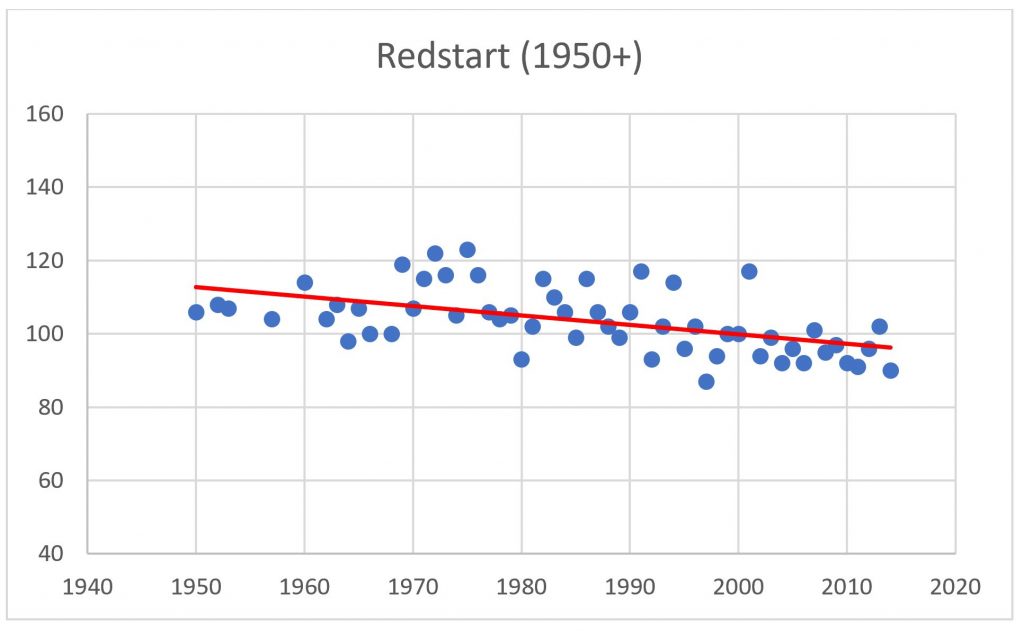
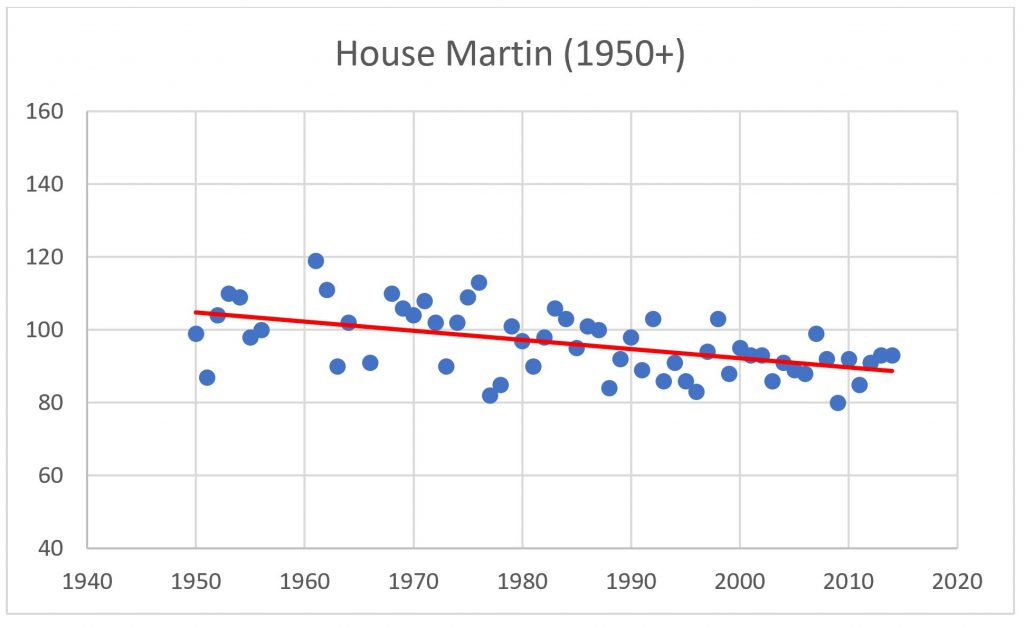
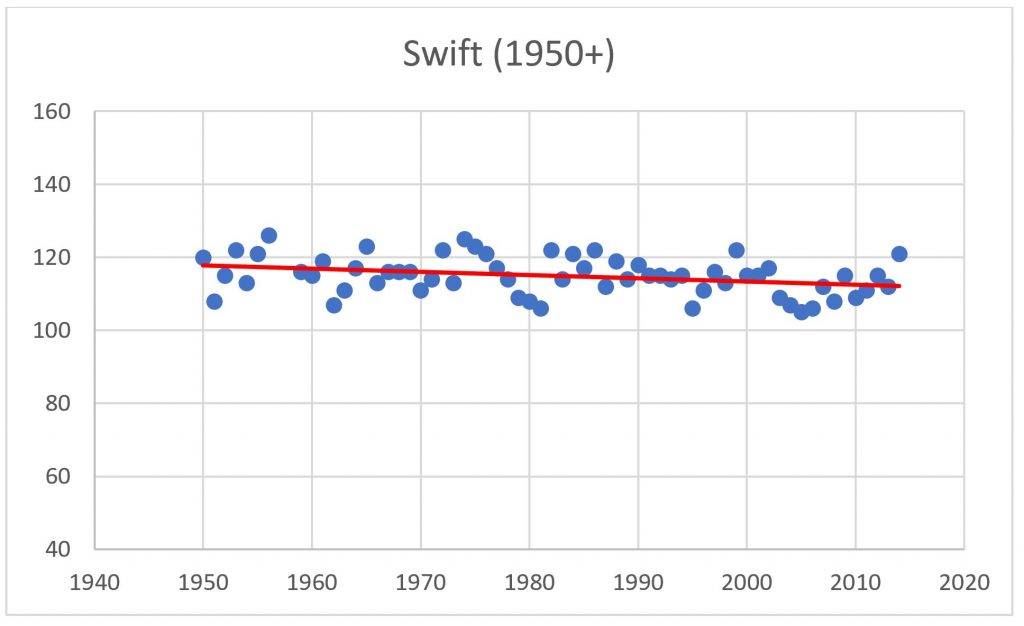
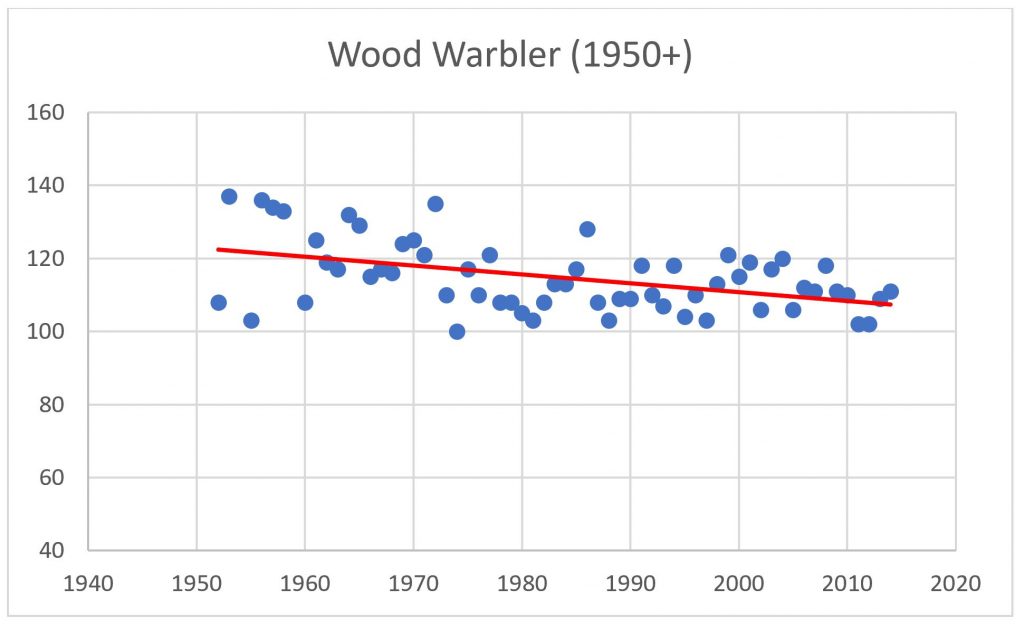
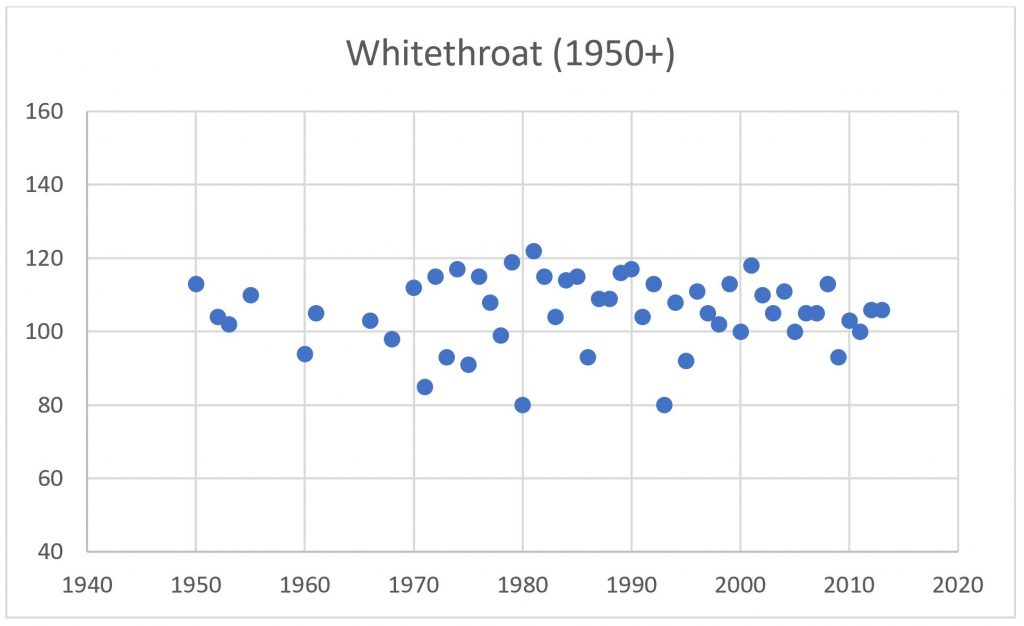
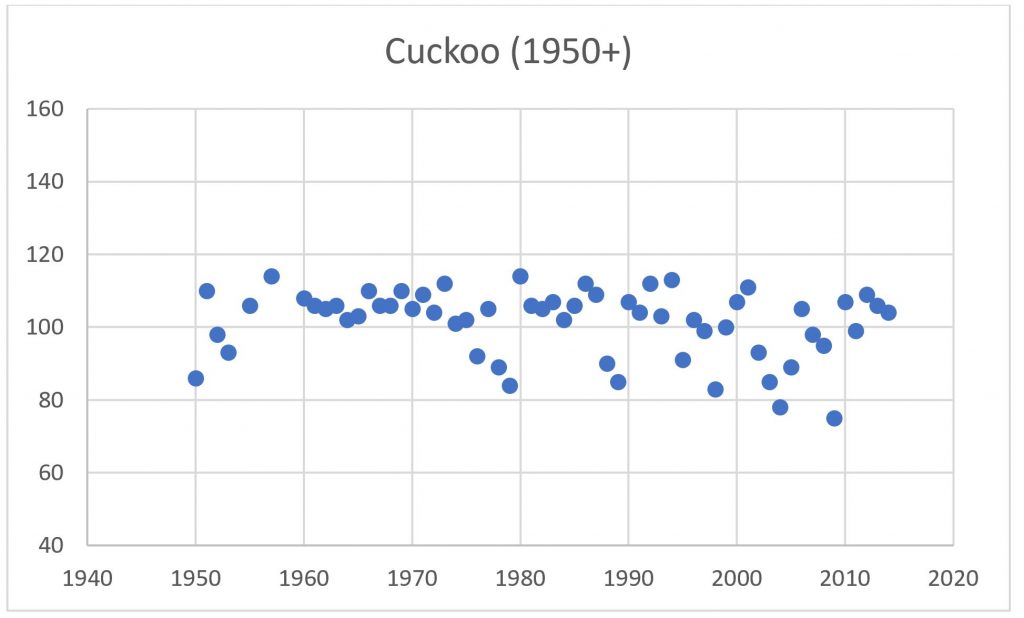
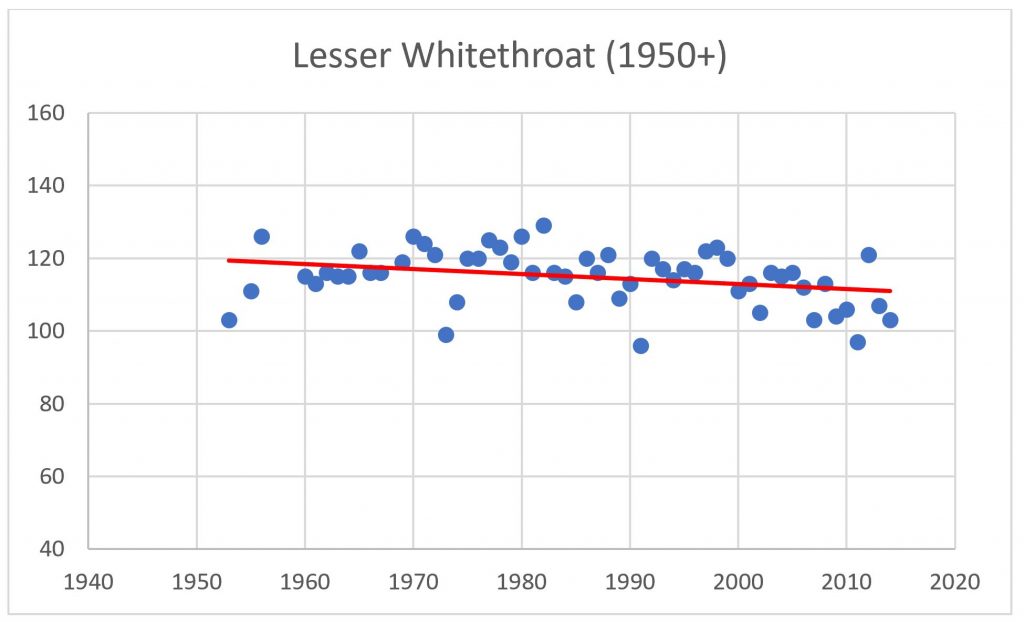
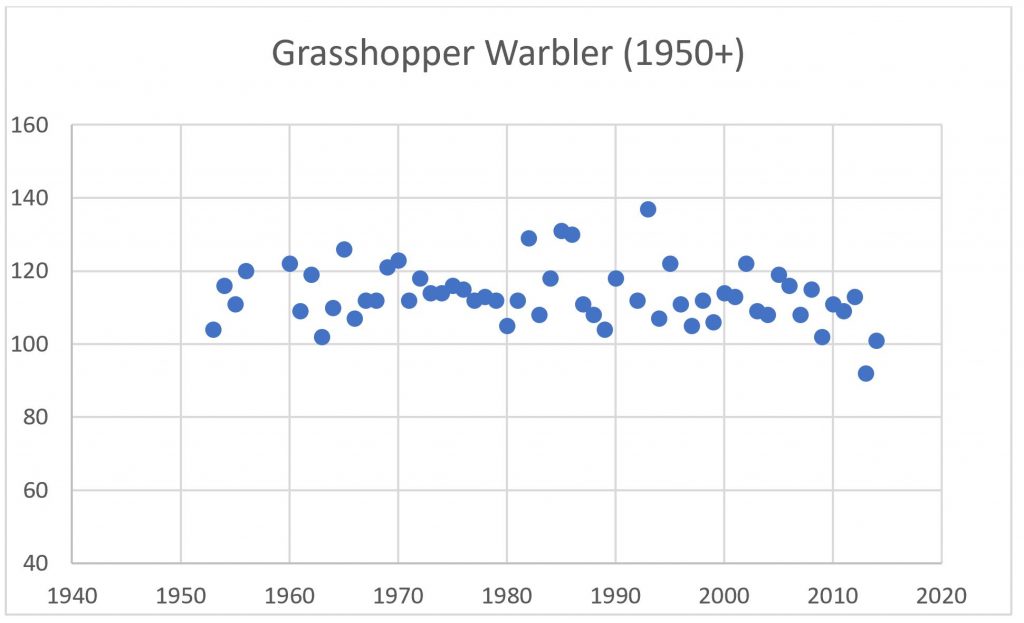
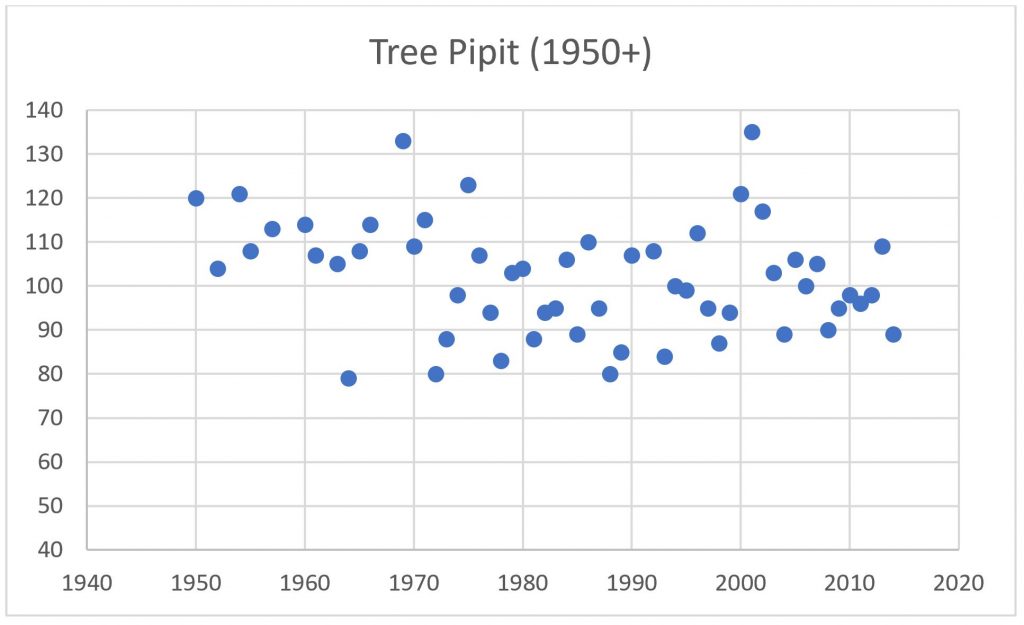
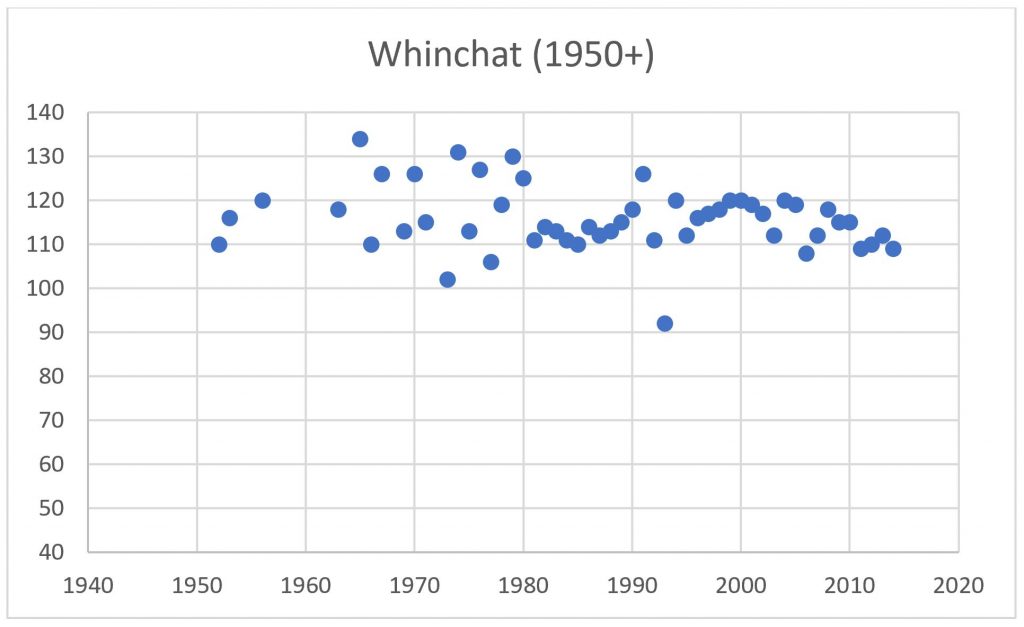
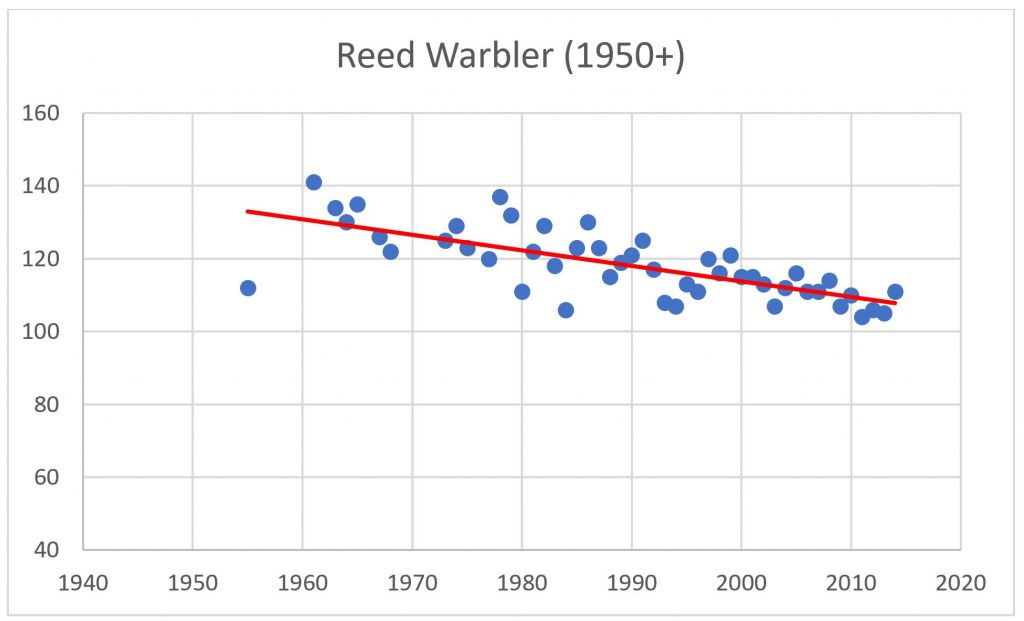
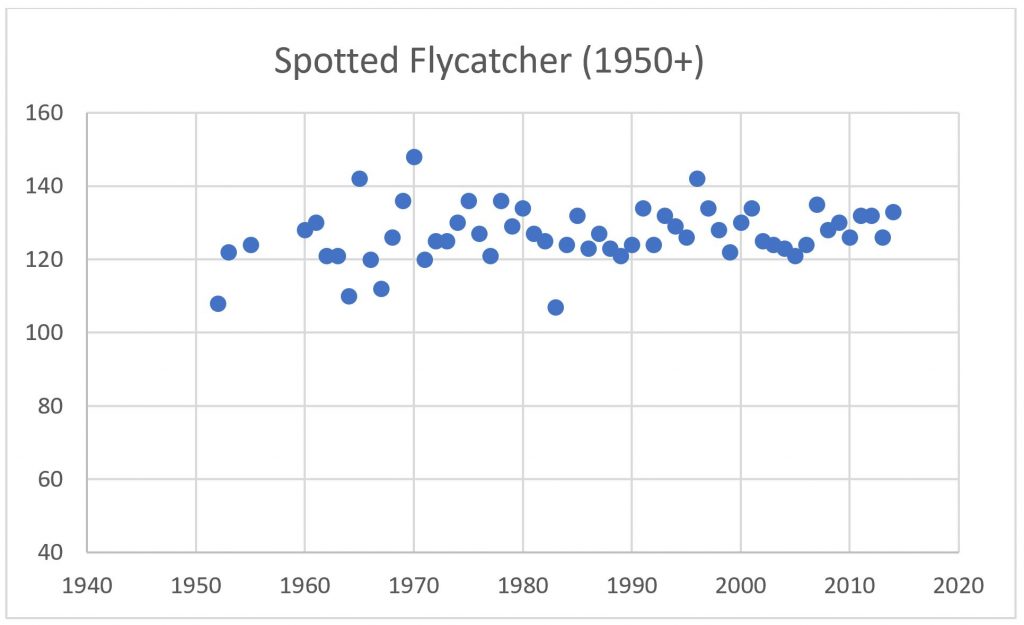
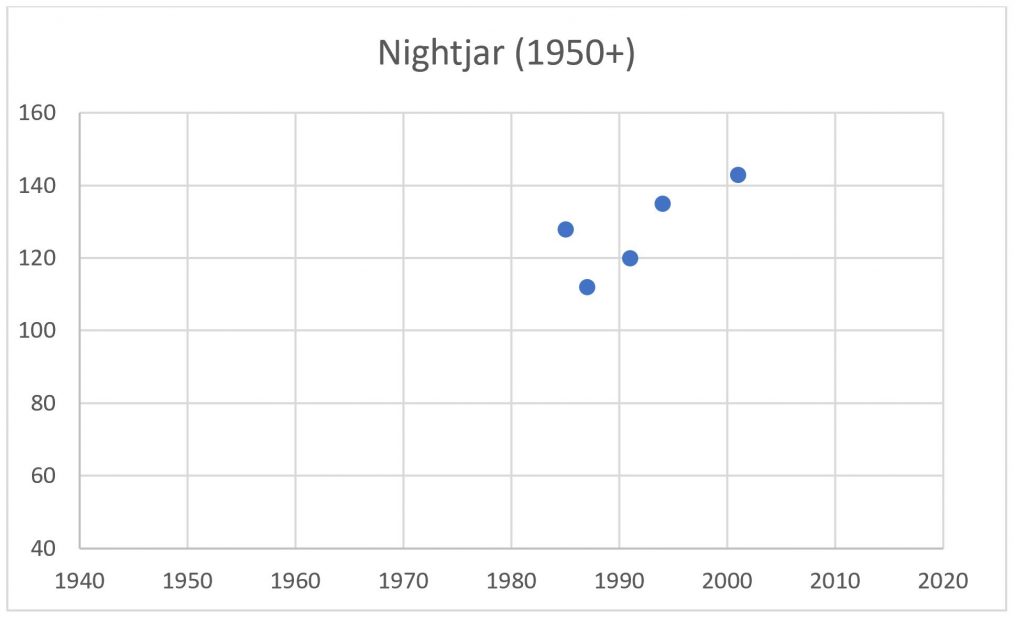
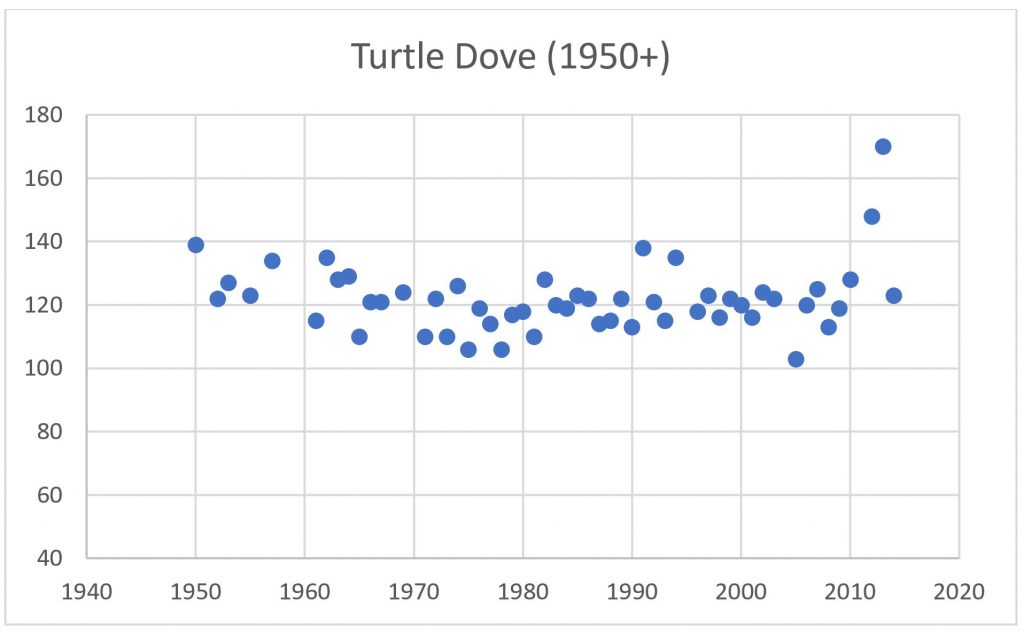
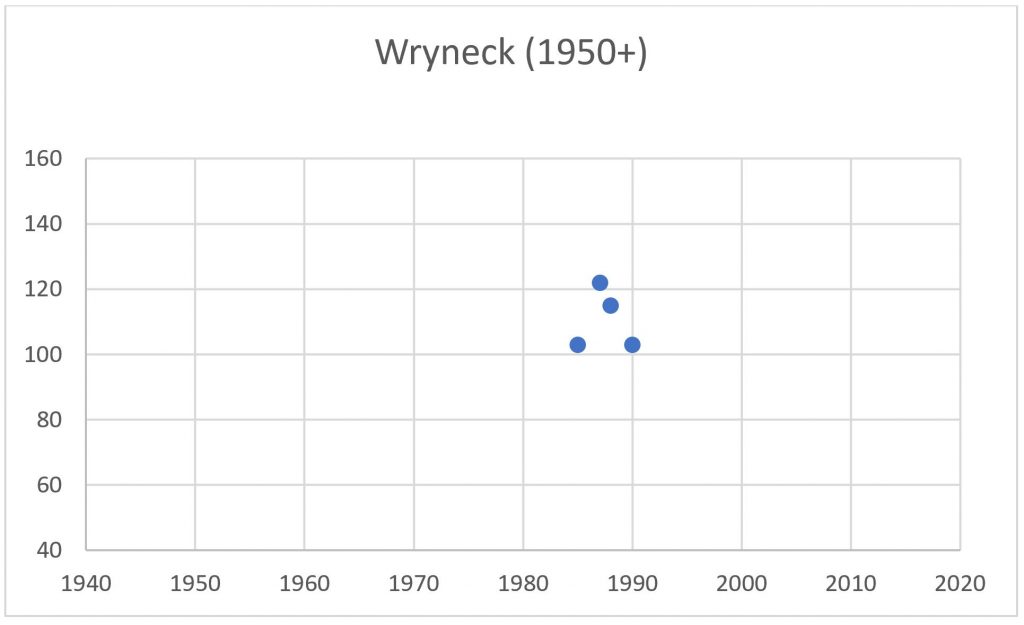
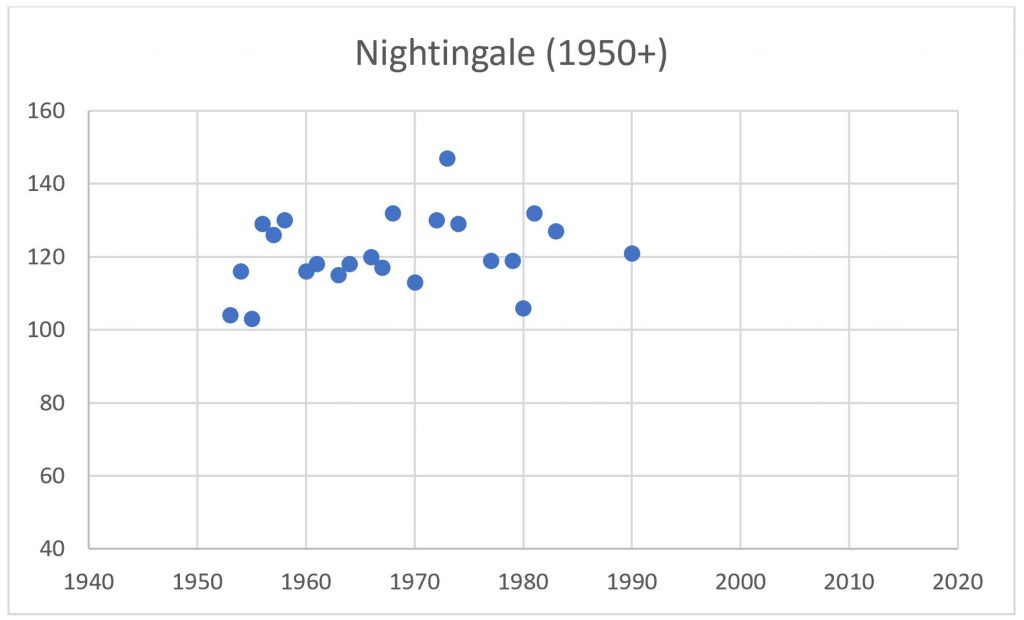
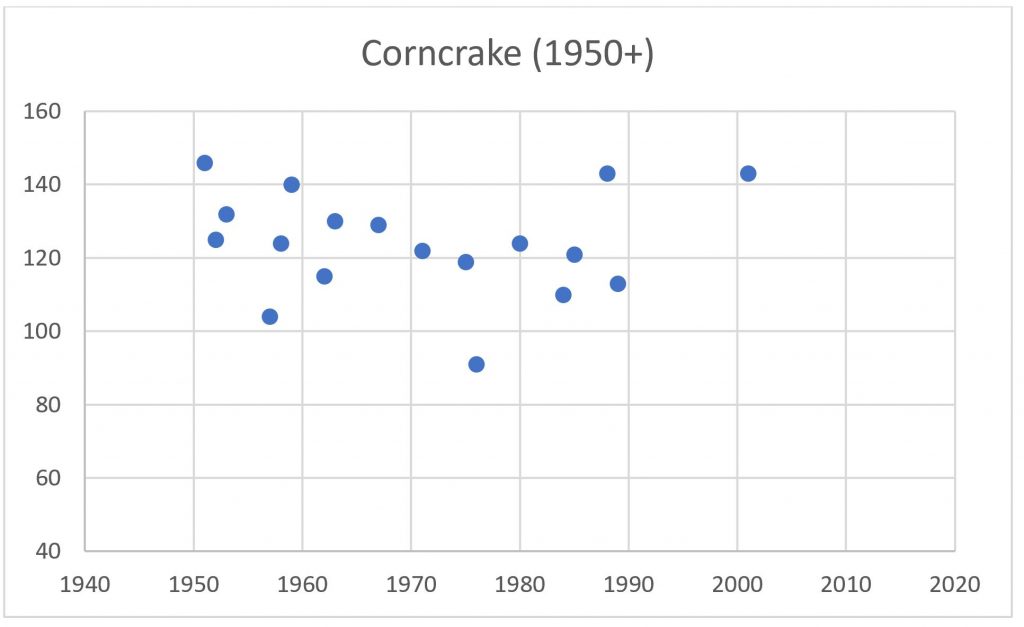
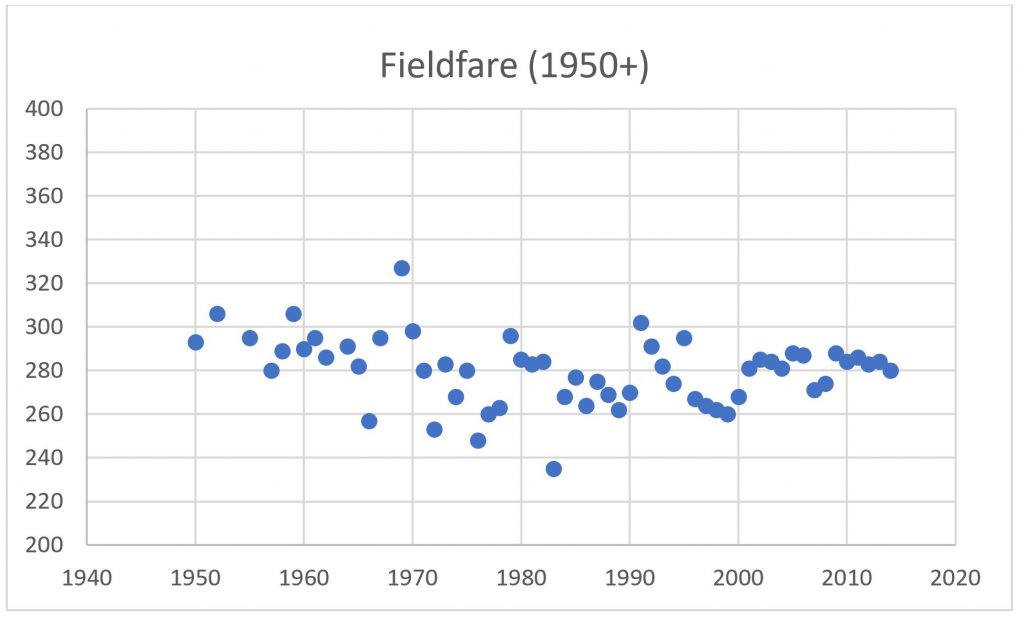
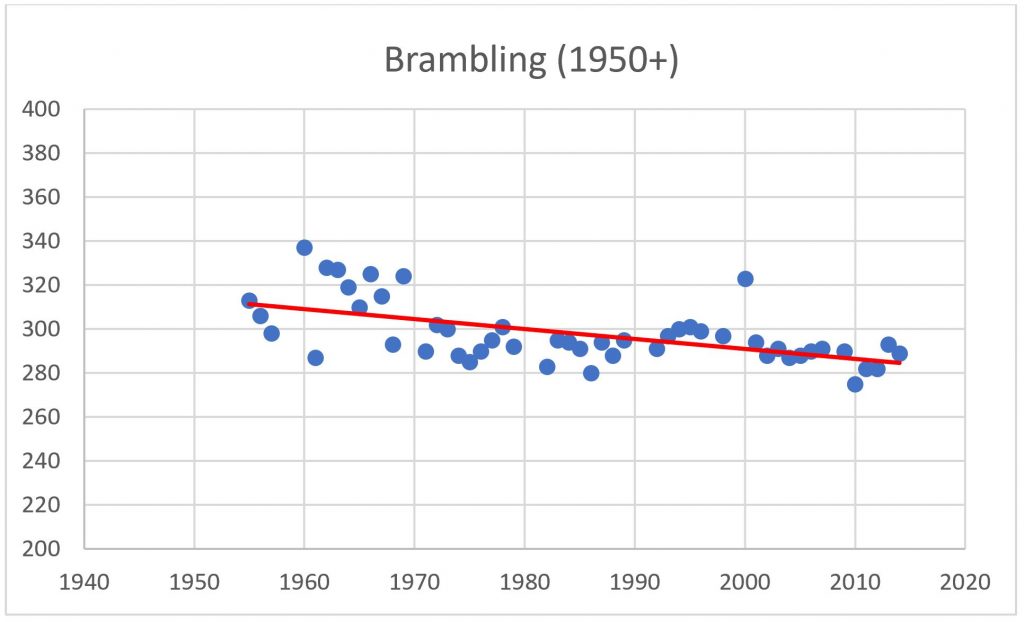
This page shows all SMAD first arrival dates over the period 1950-2014. These relationships (where significant in a statistical sense) were used to estimate the 2014 arrival date. The horizontal axis shows years from 1860 to 2020. The vertical axes of all graphs for spring migrants, which shows arrival day-number, are identical. Likewise, the vertical axes for all autumn migrants are identical (although different from the spring cases). For spring arrivals, the axis range is from from 60 (March 1) to 160 (June 9). For autumn arrivals, the equivalent range is from 230 (August 18) to 250 (September 7).
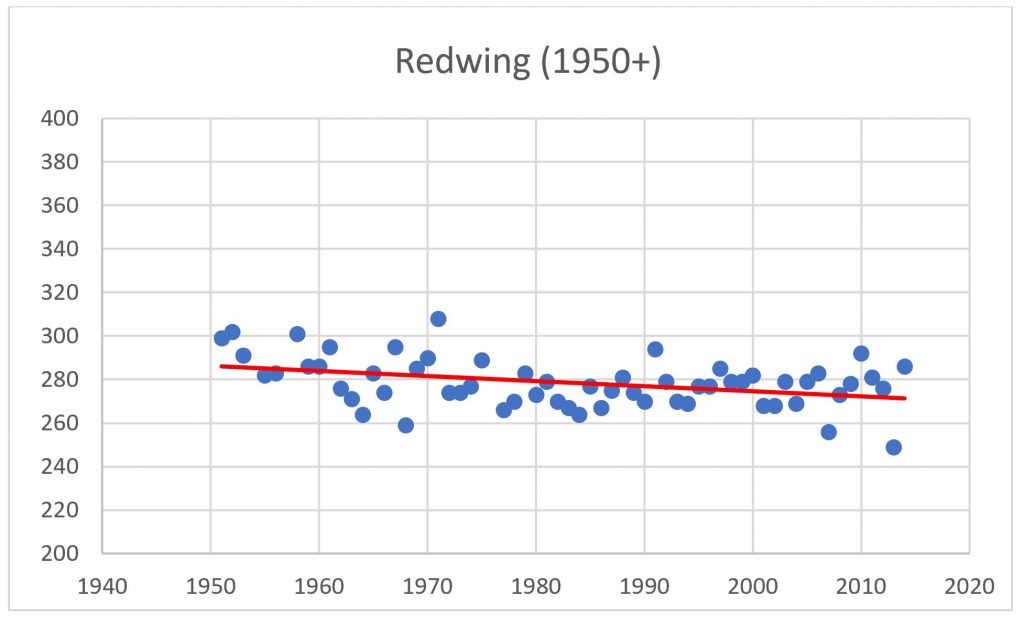
A red trend line is included as a generalised measure of the time-dependence of first arrival date over the period of record for each species; it is not intended as a predictive tool. The red line is the least-squares regression line and is shown only when the slope of the line is significantly different from zero at the 95% confidence level.
To see any of these graphs at a larger size, click on the image and an expanded version will open in a new page. Close the page to return here.
Spring Migrants
Autumn Migrants
![]() Return to Avifauna Supplement Home
Return to Avifauna Supplement Home
![]() Return to SOS home
Return to SOS home
![]()