The Species Index page provides access to maps, tetrad occupancy tables and relative abundance bandwidth data for all species from the current survey period for which such items are deemed useful. whether these appeared in the printed book or not. This does not include every such item. The criteria for inclusion are as follows:
Maps.
For distribution, relative abundance and breeding change maps, there must be five or more tetrads with data for inclusion. These maps are presented in a “gallery” at the top of each species section. If all maps are available, the gallery includes maps in the following order:
- current survey period breeding season distribution and status
- current survey period winter distribution
- current survey period breeding season relative abundance
- current survey period winter relative abundance
- the breeding season distribution and status from An Atlas of the Breeding Birds of Shropshire (1992)
- breeding change between the two periods.
Where a map is not available or does not meet the criteria for inclusion, it is excluded from the above sequence.
The 1992 atlas map is distinguished from the current survey period map for breeding distribution and status by the colour of the plotted points. These are burgundy, in contrast with the bright red of the more recent data.
If you click on an image in this gallery, it will open full-page size in a new webpage. This page will have <Previous and >Next links at the top of the page, permitting you to move through all of the maps for that species without returning to the gallery. To return to the species page, use your browser’s back button.
Relative Abundance Data.
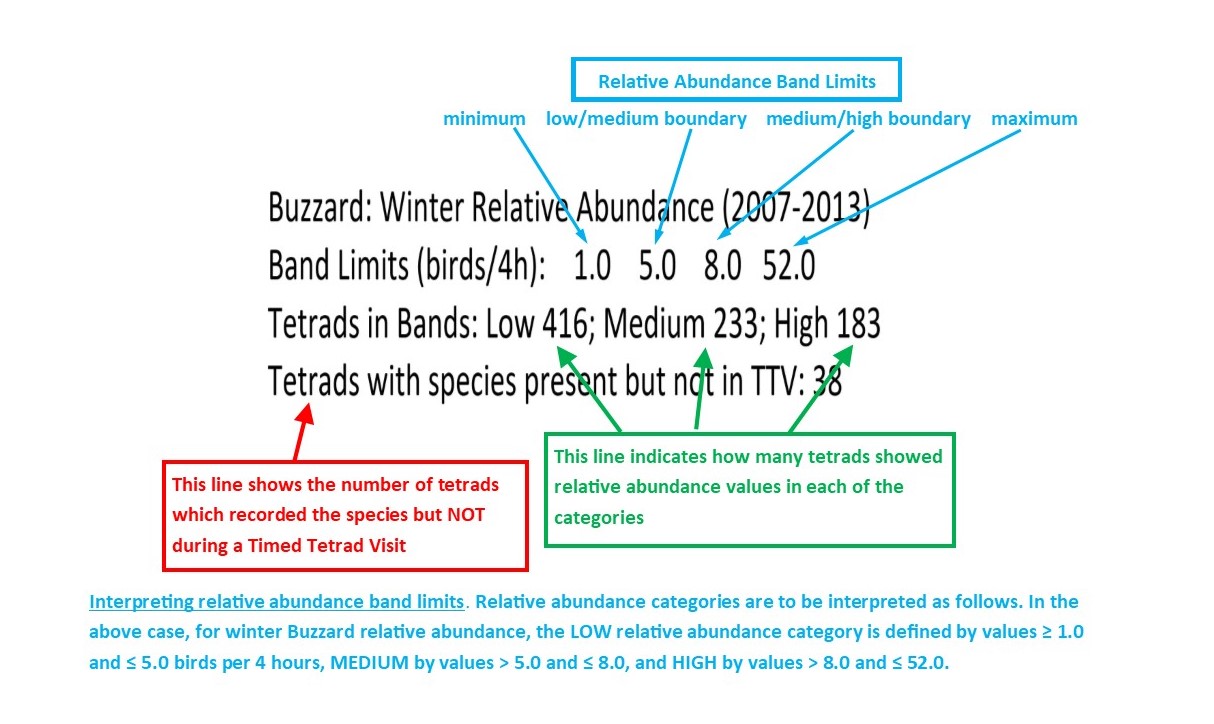
The colour scheme identifies areas of ‘high’, ‘medium’ and ‘low’ species abundance. The ‘high’ category (darkest colour) includes approximately 25% of squares where the highest numbers were counted on Timed Tetrad Visits (TTVs). The ‘medium’ band includes about 25% of the cases and the lowest 50% (approximately) are designated ‘low’.
However, where necessary, boundaries between bands have been adjusted so that the same count does not occur on both sides of the boundary. The method imployed is as follows. Tetrad relative abundance data are arranged from smallest to largest. The first 50% of tetrads is identified and the highest relative abundance in this group value is inspected. If the lowest numbers in the ‘medium’ category are identical to this number, the boundary is shifted to the next highest relative abundance value. This constitutes the low-medium boundary and all tetrads with abundances lower than this are designated in the ‘low’ category. The remainder of the distribution is then divided into half. Again, if the highest abundance in the next largest group (‘medium’ ) is identical to the lowest numbers in the provisional ‘high’ category, the medium-high boundary is adjusted upwards to the next highest value. Finally, remaining tetrads are classified as ‘high’. As a result of this algorithm, there may sometimes be only two relative abundance categories (‘high’ and ‘low’) if the frequency distribution dictates this. (It is also possible to have only one category; e.g. if all relative abundance values are identical.) . Relative abundance maps also show tetrads where the species was found during the relevant Atlas period, but not during a TTV.
Relative abundance band limits are shown for each species with a relative abundance map for a given season. This information is not provided in the printed book and is available only here. The following example shows how to interpret these data, which will be presented only if the equivalent relative abundance map is provided..
Tetrad Occupancy Tables (TOTs).
A TOT is provided only if one or more of these criteria is satisfied.
- if confirmed or probable breeding was reported in either An Atlas of the Breeding Birds of Shropshire (1992) or the current Avifauna,
- if the table appeared in the printed book, or
- if at least one cell of the table reports five or more tetrads occupied.
There are two indices available for your use. You may select either to access the relevant data. The left-hand column shows species in taxonomic order, as used in the Avifauna. The right-hand column shows species in alphabetic order. Please see the important information above the indices themselves on the index structure.
![]() Return to Species Index
Return to Species Index
![]() Return to Avifauna Supplement Home
Return to Avifauna Supplement Home
![]() Return to SOS home
Return to SOS home
![]()